
Research: Mark Baker
IN ADDITION |
|
Our 50th anniversary has given Euromoney a unique opportunity to gauge the health of the global banking industry in 2019. Our editorial team has spoken to close to 70 bank chief executives around the world since the start of the year.
Many of them are featured in this issue, especially those at western banks that remain (for now) the biggest players in global finance. Readers who want deeper insight into the views of bank leaders in the developing markets of Latin America, Asia, the Middle East, Africa and emerging Europe should revisit our March and May issues.
This generation of bank chief executives is a humble, more battle-hardened group than the one that came before. They have all had to deal with setbacks. They have all seen the outcomes of excesses in the past. They see themselves as stewards of their firms. They are interested in planning over the longer term. That includes planning for the leaders that follow them. They want their bank to have a positive impact, not just for shareholders and employees but for issues that matter to them and all their stakeholders, such as dealing with poverty and climate change. Their institutions appear to be in good hands.
Many have been in charge of their banks for a long time. They have tried to steer their businesses to a stronger place, often under severe pressure. Net interest margins have stayed horribly low. Investment banking and markets business remain challenged. Technology is disruptive, while spending on technology is a core investment that continually adds to their cost bases.
Regulation has bitten hard, perhaps leaving even more of a mark than the fines that total more than three times the amount paid out by the tobacco industry for hiding the effects of smoking. It’s a huge frustration for many chief executives that legacy issues continue to take up so much of their time, effort and earnings. ‘No new mistakes’ is probably the best strategy they can aim for.
These are the negatives. But there are positives as well and there are numbers that prove it.
The new normal is the old normal
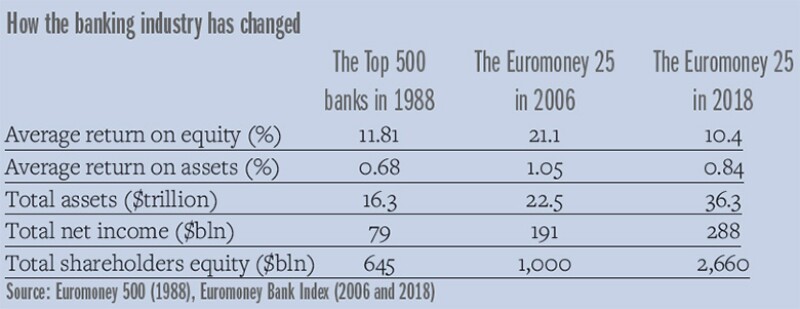
In our 20th anniversary issue in June 1989, we published our ranking of ‘The Euromoney 500’, representing how the banking industry stood in 1988. As the name of the ranking suggests, we compiled data from the leading 500 banks in the world at the time.
Those 500 had combined shareholders’ equity of $645 billion and total net income of $79 billion. Their combined total assets stood at $16.3 trillion. The average return on equity was 11.81% – the previous year it had been 8.6%.

This year, Euromoney started to compile a new ranking and index, based on a carefully selected group of 25 banks that we believe represent a benchmark for the global banking industry – the Euromoney Bank Index. The index aggregates seven key metrics (revenues, pre-tax profits, assets, return on equity, return on assets, cost-to-income and core capital) for this set of banks to produce an assessment of sector health. The index aims to show the direction of travel of the global banking industry since the depths of the financial crisis.
These are not just the biggest banks. They are mostly international in outlook and operations; and while developed market banks make up the largest part of the group, we have also chosen banks that represent the growth markets of Asia, Latin America and the Middle East.
The banks in our initial set are: Bank of America, Barclays, BBVA, BNP Paribas, Bradesco, China Construction Bank, Citigroup, Credit Suisse, DBS, Deutsche Bank, First Abu Dhabi Bank, Goldman Sachs, HSBC, ICBC, Itaú Unibanco, JPMorgan, Morgan Stanley, MUFG, Qatar National Bank, Royal Bank of Canada, Santander, Société Générale, Standard Chartered, UBS and UniCredit. We hope to add banks from Africa and emerging Europe.
The aggregate of the Euromoney 25’s full-year 2018 results gives a fascinating insight into how the industry has changed in the last 30 years. Total shareholder equity is $2.6 trillion – more than four times that of 1988, and from just 1/20th of the number of banks we surveyed three decades earlier. Net income is also four times as high, at $288 billion. Assets are more than double, at $36.3 trillion. Although the financial crisis was meant to lead to smaller banks, the stark truth is that the big banks have got much, much bigger.
|
|
|
|
|


But look at the returns these bigger banks of today make. Average return on equity is 10.4%, in line with the late 1980s. Return on assets is a little higher on average, at 0.84% compared with the 500’s 0.68% in 1988.
Now compare that with how the industry looked in 2006, just before the crisis hit. Euromoney compiled data from the 25 banks we cover today going back to that year. In 2006, these 25 banks produced aggregate net revenues of $191 billion on shareholders’ equity of $1 trillion. That generated an average return on equity of 21.1%.
The stark lesson here is that the returns that leading banks generate today are roughly in line with the historic trends of the industry. The blip was the high-leverage, prop-trading days of the late 1990s and the early 2000s. It’s worth remembering that in 1998 Deutsche Bank, by then the bank with the biggest balance sheet in the world, was producing a return on equity of a little over 12%. Today’s returns aren’t so much the new normal as the old normal returned.
The industry is in better shape than you might think
The nadir of the global banking industry was 2008. How has banking responded in the 10 years since? Again, the data compiled by Euromoney from its group of 25 banks tell an intriguing and ultimately positive picture.
Baselined to 100 in 2008, banks rebounded relatively quickly once the worst of the write-downs were out of the way in 2009 and 2010. For the next seven years, the industry largely flatlined as it got to grips with lower revenues, corporate restructurings, fines and higher costs. Since 2016, however, the industry has been on a clear upward trend. So much so that the current level of the overall index, at 185, is just five points below the high-water mark of 2006.
Do bank chief executives agree with this assessment? Yes and no. In a rather more subjective survey than the Euromoney Bank Index, we asked many of the bank leaders Euromoney has spoken to over the last five months to give us two scores. The first, out of 10, is based on how well they thought their own bank was positioned to succeed over the next five years, with 10 meaning they were perfectly positioned; the second, also out of 10, scores their view on the outlook for the global banking industry over the same period.
The average score that chief executives gave for their own institution was 7.6; the average score for the industry as a whole was 6.4.
Why the disconnect? This could easily be put down to the natural bias of people to view their own business in a positive light. But, as we say earlier, this generation is generally a more considered bunch than that.
The more likely explanation is this: most chief executives think they have done a more than reasonable job positioning their bank to meet the challenges of the future. The scores for their own firms reflect a belief that they will perform as well as they can, given a stable backdrop and the cards they have been dealt. It does not necessarily mean they expect to outperform the industry, which they all accept continues to face some deep challenges in the years to come.
Good management, more than ever, is the key to success
If there is one thing you can get all the chief executives of today to agree on, it is the fact that banks were very poorly run as businesses for a long time. The excesses of the pre-financial crisis era have left their mark. Fifteen years ago, efficiency was an afterthought. There was no need to worry about the cost part of a cost-to-income ratio when revenues were easy to come by.
Now the right-hand side of the equation is tough and so is the left-hand side. Good banks need to be ruthlessly efficient. That means spending wisely; it doesn’t mean cutting investment in core areas, such as people and – especially – technology. Getting that right is vital.
There has been so much attention in recent years on bank’s cost-to-income ratios that it almost appears to be the key measure management teams are seeking to manage. Intriguingly, our index shows cost-to-income ratios have changed little, perhaps showing that earnings decline in line with operating expenses and that, for all their efforts to trim staff costs, banks need to keep spending on technology.
Most chief executives are trying to take a long-term view of their businesses. That’s the right approach, of course, but not always easy to do. The focus on quarterly results is a tyranny that hurts the industry as a whole. It is exacerbated by the changing nature of investment managers, into a mixture of passive ownership and high-frequency trading. This means that banks tend to trade as a group with little differentiation in the long term because of the former, but can suffer short-term fluctuations because of the latter. Managing through that is tough. It requires conviction and support from the board. And it requires the right person at the helm.

One of the disappointments of our 50th anniversary coverage is to be drawn again to the lack of gender diversity among bank leaders. Of the nearly 40 bank chief executives featured in this issue, only one is a woman. It is something the industry should be ashamed of. There’s no quick fix to this – it requires at least a generation to change a male-dominated industry to one more reflective of society. The good news is that most of the male chief executives take the issue of diversity seriously. It is to be hoped, if not expected, that by the time of Euromoney’s 60th anniversary there will have been some positive movement in this direction.
Last, but certainly not least, this is a critical moment in how banks are perceived by broader society. It’s instructive to visit emerging economies, in Asia, the Middle East or Latin America, and see how banks are respected as vital agents of change in economic and societal growth. Banks in the developed world lost this privilege during the financial crisis, but the attitudes and actions that led to this collapse in trust started many years before.
Banks play a crucial role in people’s everyday lives. The way they conduct their relationships with customers is changing fast – many chief executives think the smartphone has heralded the biggest change in banking in their lifetimes. But if banks truly want to be a life partner to their clients, they need to reflect the changing priorities of their stakeholders. That, in the end, will be the key to restoring trust in the banking industry, alongside demonstrating that they are well-run businesses with a clear strategy for the long term.
And, Euromoney is pleased to report, that goal is coming into sight.
About the Euromoney Bank Index
The Euromoney Bank Index (EBI) is based on seven metrics that are key indicators of the sector’s health: revenues, pre-tax profits, assets, return on assets, return on equity, core capital and cost-to-income. We collated data on these metrics for each of the 25 initial constituents of the EBI back to 2006, the last ‘clean’ year before the global financial crisis.
We picked the year 2008 as the base level of 100 for our index, marking the low in most metrics for most banks in our set and making the EBI a measure of post-crisis recovery. We then extrapolated the index back to 2006 and forward to 2018.
Averaging the index values of all metrics in each year for each bank gave us a 2006 to 2018 index series for each bank. Averaging all banks’ overall index values in each year gave us the overall EBI values for each year. The index is equally weighted, both in terms of the seven metrics and in terms of the constituent banks.
Separately, we have tracked the aggregate progress of each of the seven metrics. Again, for ease of comparison we have indexed these to a base of 100 in 2008, with the exception of the cost-to-income ratio, which we benchmarked to 2009 to eliminate the wild spike of 2008, caused mostly by Swiss banks.
By necessity, such an exercise involves the aggregation of data that are not always strictly comparable. Different banks adjust their earnings in different ways – there are slight variations in the way in which they calculate return on equity, for instance, if they report it at all.
Cost-to-income ratios for every bank are generated by us on the basis of total operating expenses as a percentage of total pre-provision revenue. Return on assets is calculated for every firm using after-tax profit as a percentage of average assets, which if not reported is taken as a simple mean of the two year-end figures. Where a bank does not report return on equity, we have calculated it using net profit attributable to common shareholders as a percentage of average shareholder equity, excluding non-common stock items such as preferred stock and other instruments, again using a mean of the two year-end figures.
Depending on jurisdiction, banks have adopted different measures of capital adequacy at different times. At the start of our period, most worked on the basis of tier-1 ratios; and so we use that for almost all banks until 2009. At this point the main capital ratio switches to core tier-1 or tier-1 common, until the widespread adoption of common equity tier-1 (CET1) under Basel III for most banks by around 2013, but there are discrepancies within this reporting. We have used transitional CET1 whenever reported.
Not all banks use the same 12-month period year for their fiscal reporting: Canadian and Japanese banks’ fiscal years do not match calendar years; nor did the broker-dealers Goldman Sachs and Morgan Stanley until they switched to bank holding companies during the financial crisis.