Momentum strategies, however, have remained largely unaffected by RORO. So, what is the optimal momentum strategy? HSBC recommends the Kiss approach – keep it simple stupid, in a statistical sense, that is. The most common type of momentum strategy in FX is the moving-average cross-over model. In their most basic form, single moving average (SMA) momentum models work by generating buy signals if a currency pair is trading above its moving average, and a sell signal if the pair is trading below this level.
“Despite their popularity, there are serious problems with moving average strategies from a quant perspective,” says Stacy Williams, a quantitative FX strategist at HSBC, and the author of the report Momentum: Don’t Stop Me Now.
“From a purely mathematical point of view, using the average value of a non-stationary data series to calculate statistics is deeply worrying, which could lead to inconsistent signals.”
In the report, Williams attempts to show that a less complex trading model offers superior risk-adjusted returns than the models based on moving averages. Moreover, Williams argues it provides a better foundation upon which to base more sophisticated momentum strategies.
Basic momentum versus SMA
The basic momentum (BM) strategy generates a trading signal dependent on whether the current price is above or below a defined price at time T. As with all momentum strategies, if a currency pair is trading above the price T days ago, a long position is held for the following day, and conversely if the price is under the exchange rate at time T, a short position is established. The strategy is therefore always either long or short, but never square.
While the comparison of trading strategies is a delicate task, HSBC used Sharpe ratios to measure and compare performance between the two strategies during a period between 1999 and 2011 using pre-defined T-values.
HSBC calculated T-values that would have given the highest Sharpe ratio at the end of each calendar year, and then used these values for the following year, as an unbiased and intuitive way to proceed with the analysis.
The results are striking. Using the same optimized T-value for all currency pairs under the BM strategy gives an average Sharpe ratio of 0.16 for an equally weighted basket of returns using G10 currency pairs. The optimized SMA strategy comes out with a negative average Sharpe ratio of -0.08.
Going a step further, by individually optimizing the T-values for each currency pair using the same methodology, it makes the difference even more profound. The average Sharpe ratio for the currency-optimized BM strategy increases to 0.35 while the SMA strategy hardly changes, coming out at -0.05.
| BMA optimization better than SMA optimization for almost every pair |
 |
| Source: HSBC, Bloomberg |
For almost every currency pair, the BM strategy gives a higher Sharpe ratio than for the optimized SMA strategy.
“It is the consistency of this outperformance which is the strongest evidence in favour of the BM strategy,” writes Williams in the report. “As a result, we recommend using the basic momentum strategy as the foundation of trend following strategies.”
How good are the Sharpe ratios?
However, some traders might say a trading model that offers a Sharpe ratio of 0.35 would not be worth the bother. HSBC stresses that the above strategies would form only the bare minimum of a trading strategy, but it gives a valuable indication of expected performance. In most cases, traders are likely to add additional sophistication to the basic strategy to improve performance.
It should be noted that to get an objective measure of Sharpe ratios, one needs to measure over a longer period to eliminate noise and over- or under-estimation.
At a time when many are questioning the ability of FX to deliver a long-term return as an asset class in its own right, HSBC says FX momentum out-performed equity during the sample period. The Sharpe ratio of a long-only S&P 500 position – including dividends – during the same sample period has only been 0.05.
Positive and diversified returns
“As one strand in a portfolio of trading strategies, a Sharpe ratio of 0.35 can make a major contribution, providing it is uncorrelated to the returns from your other strategies,” adds Williams.
HSBC shows that unlike carry trade strategies, the returns of momentum strategies and other risk premia have not changed since the financial crisis and RORO behaviour came to dominate markets.
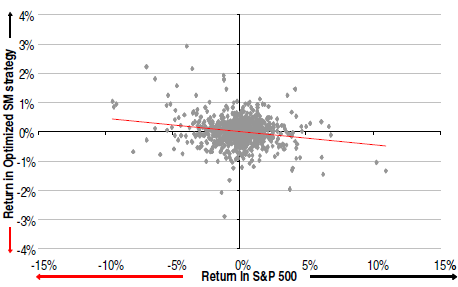
Both before and after the crisis, the returns from the optimized BM strategy have displayed little correlation with returns in the S&P 500, suggesting that FX momentum strategies are now more valuable than ever as a diversified source of returns.
| BM returns vs S&P500 returns (post 2008) |
 |
| Source: HSBC, Bloomberg |