In the boom years before the financial crisis of 2008, the mantra at the big global corporate and investment banks was to be all things to all clients. Product-agnostic, market-agnostic – there was no end to the spread of business. Until the end came.
But how those same firms responded to the crisis varied wildly. The biggest and already most genuinely diversified – not in terms of investment banking product but across their whole banking portfolio – generally fared the best in the teeth of the turmoil and the years that followed.
| Jump to: The data, bank-by-bank |
Deutsche Bank was an outlier in that regard, reflecting its reliance within its investment bank on trading and an aggressive approach to risk that ran against its origins as a corporate banking stalwart.
But some firms turned out to be less diversified than they might have appeared. Their mix within investment banking might have been broad, but they had precious little in the way of stable, boring banking to support their suddenly struggling capital markets and trading franchises.
More than a decade later, a Euromoney analysis of the changing revenue mix at a dozen of the highest-profile corporate and investment banks shows a dramatic divergence in approach. For some, like Deutsche, that change has been most marked in the last 12 months. For others, it has been a steadier progression.
There is little question that the global investment banking business model has been uprooted.
The received wisdom is that everything from the electronification of markets, ever-shifting regulatory burdens, the emergence of non-bank actors as true competitors, the growth of passive investment and the effective death of interest rates have conspired to make the pre-crisis model of a big lending, advisory and trading shop a thing of the past.
Or has it? What is the local picture at the top firms and how does the industry look in aggregate?
Some things are unquestionably different. There are banks that have had to pick their spots, even exiting businesses where they might have been leading players but whose returns just no longer add up.
Others, within which global investment banking and particularly trading businesses never sat comfortably in the first place, have pulled back to their roots.
But the aggregate story is rather different and surprising.
As the 2019 earnings season came to a close for the biggest investment banks, Euromoney compared those numbers with those of the pre-crisis year of 2006 to gauge how the dozen biggest global corporate and investment banks have changed – and how they have not.
Taken as a whole, revenues in dollar terms at the operating divisions of the 12 banks had recovered to a little over their pre-crisis levels, with a 7% increase to about $604 billion.
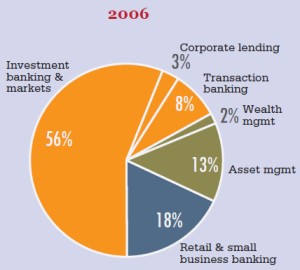
But the most striking finding was in revenue mix. As our two aggregate charts show, the broad mix between retail, corporate and investment banking, and asset and wealth management in 2019 is within just a few percentage points of what it was in 2006. Corporate and investment banking accounted for 45% of revenues in both 2006 and 2019. Wealth and asset management is up a little, retail down a little.

What's changed
If the overall revenue mix is practically the same, what has changed? The answer can be found in which firms are generating those revenues, as well as the mix within nearly all 12 banks.
Firms that struggled because they were not diversified enough have spread their wings. Those that were too stretched across businesses have specialized. The small number that were already diversified and in good shape have become even more so – and that has tended to mean the big beasts of the US.
The five US firms in our set of 12 accounted for 52% of revenues in 2006. In 2019 that stood at 60%. JPMorgan alone accounts for nearly one fifth of revenues: in 2006 it was the fourth largest; now it has the biggest slice of a bigger pie.
From being a firm that was dominated by corporate and investment banking (CIB), Credit Suisse is now more or less evenly split between CIB and asset and wealth management.
UBS has gone the other way, slashing the relative size of its investment bank in favour of a wealth and asset management business that now accounts for 62% of its total revenues.
Morgan Stanley looks similar to Credit Suisse, reducing its investment bank and shedding its cards business to end up fairly evenly split between CIB and asset and wealth management, which will grow with the E*trade deal.
Goldman Sachs in 2019 looks more like Morgan Stanley did in 2006, having doubled its asset and wealth management since the crisis as it looks to widen its scope from ultra-high net-worth to mass affluent – with a sliver of consumer banking thrown into the mix.

Among the universal banks, JPMorgan, Societe Generale and BNP Paribas look the least changed, with just a few percentage points of difference in their mix from 2006 to 2019.
Wealth management has more than doubled its importance to Bank of America – with a consequent fall in retail as a share of the total – while it has halved at Citi, where investment banking and transaction services have seen big rises.
HSBC and Barclays have both ramped up the percentage of revenues contributed by transaction banking, but now also have bigger-contributing investment banks, resulting in a marked decline in relative importance of retail banking at HSBC in particular.
Given its tribulations of recent years, Deutsche has seen a predictable decline in the relative contribution of its investment banking and markets business, but an increase in broader corporate banking means that its overall CIB contribution has only fallen by 13 percentage points.
In 2006, investment banking and markets was the biggest revenue contributor at four of the 12 firms. Now it is the biggest at just two. Retail banking was the biggest at seven in 2006, and it remains the biggest at the same seven now. But while asset and wealth management was the biggest business only at UBS in 2006, it is now also the biggest at Credit Suisse and Morgan Stanley.
Only four firms – Citi, Barclays, HSBC and BofA – have increased the share of revenues from investment banking and markets activity. The rest have seen a drop (BNP Paribas and Societe Generale are excluded as they do not report investment banking separately).

This makes sense. From a revenue perspective, those four retail giants were the firms with the smallest investment banks relative to the rest of their business back in 2006 and so had the most scope to increase. None has seen a big shift however; the increases are single-digit in each case.
Notable, however, is how small BofA’s investment bank was pre-crisis, at just 11% of revenues, and how small it remains even after the acquisition of Merrill Lynch, at 20%, making it the smallest investment bank in revenue percentage terms, alongside HSBC.
At the other end of the spectrum, Goldman is inevitably still the firm with the biggest contribution from investment banking and markets, at 59%. That’s despite the firm seeing the second biggest fall in that share after Deutsche.
It’s striking to note that even after its 22 percentage point fall in revenue contribution – down from 81% in 2006 – Goldman’s investment bank now contributes the same percentage of revenues to the firm as those at Morgan Stanley and Credit Suisse did back in 2006.
Goldman might be changing, but it still looks rather similar to the most investment banking-heavy of its rivals before the crisis.
Bringing the full spectrum of corporate banking into the mix changes the picture a little. Here HSBC, Citi and Barclays show the biggest increases in revenue contribution, with fully 54% of HSBC’s revenues now coming from CIB, up 18 points compared with 2006.
As its aggregate revenue increase showed for the group of 12 banks, asset and wealth management stands out for being the business that has become more important at the biggest number of firms. Only two, Societe Generale and Citi, have seen a fall in the percentage of revenues from this area (Barclays no longer reports asset and wealth management separately). At all the other firms, it has increased, sometimes substantially.
At UBS and Morgan Stanley, asset and wealth management is now the biggest business, joined by Credit Suisse if investment banking is split out from CIB.
Diversification
What does all this mean for diversification? It is difficult to measure, but one approach might be to take the difference in revenue contribution between a firm’s two biggest businesses.
Using our three broad categories of corporate and investment banking, retail banking, and asset and wealth management, the difference between the two biggest categories has shrunk at eight of our 12 firms, suggesting an overall move towards greater diversification.
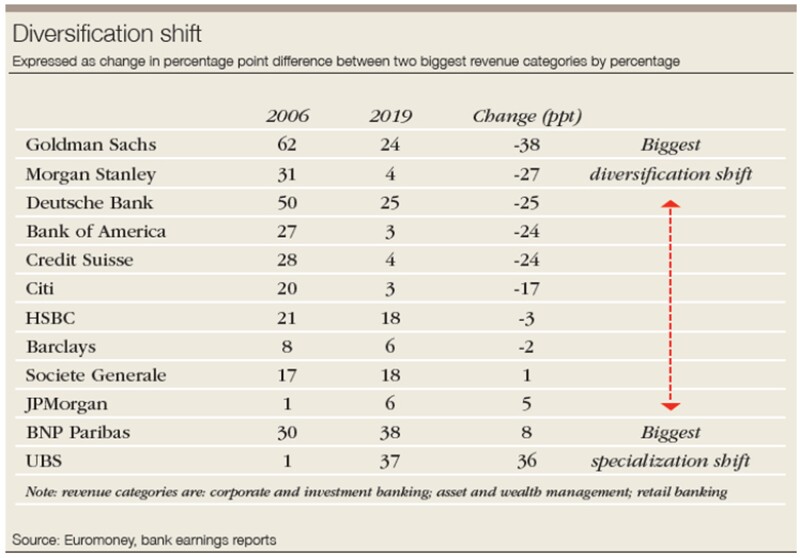
The biggest shift is at Goldman, where the difference between the revenue shares of its top two businesses has fallen by 38 percentage points, followed by Morgan Stanley on 27, Deutsche on 25 and Credit Suisse and BofA on 24. By this measure, these five firms have shown the biggest moves towards becoming less reliant on one business.
The startling outlier is UBS, where the gap between its two biggest businesses has blown out from just one point in 2006 to 37 points in 2019, a reflection of just how important wealth management has become at that firm.
On this basis, UBS is much less diversified than it was – but it is surely in better shape.
It’s a reminder that diversification is no answer if it means having a portfolio of businesses that are still below the scale they need to be to be profitable.
| The data, bank-by-bank |
| BANK OF AMERICA Revenues up 30% With Bank of America absorbing Merrill Lynch in the teeth of the crisis, its investment banking and markets business has doubled its share of the group. But it still only accounts for 20% of the total, making it the smallest on that measure alongside HSBC. Elsewhere, a trimming of consumer banking and an increase in wealth management has left the firm looking the most diversified, together with Citi, with a mere three percentage point difference between its two biggest businesses of retail and CIB.
BARCLAYS Revenues up 1% The old pre-crisis investment bank at Barclays might have often driven profits, but from a revenue perspective it was smaller than is often imagined, at just 29% of the group. That’s up to 35% now, making the firm one of the four to have seen an increase in contribution there. Multiple reporting changes make pre-crisis comparisons tricky at Barclays, but taken together, retail and asset and wealth management have fallen in absolute terms and as a share of the total. The result is a firm more shifted to its investment bank, but balanced overall between the broader CIB and retail.
BNP PARIBAS Revenues up 62% The French banks are two of the least changed in broad profile since before the crisis, with BNPP’s CIB shrinking by a mere 5 percentage points to 27% of the bank’s revenues, meaning it is probably the smallest on that measure, depending on the precise makeup of UBS’s Swiss Universal Bank. It is, however, one of the banks where overall revenues have risen, up 62%. And with its mix still roughly the same, growth has come in all areas.
CITI Revenues down 20% The bank has trimmed its sprawling international retail banking and wealth businesses. The result is a firm now roughly balanced between retail and CIB. Investment banking has increased its share of the total, on the back of rises in equities and fixed income trading rather than in underwriting and advisory. But the biggest jump has been in transaction banking, which now contributes more to the firm’s total revenues than at any bank other than Deutsche Bank and HSBC.
CREDIT SUISSE Revenues down 35% The completion of a three-year restructuring under recently departed chief executive Tidjane Thiam has crystallized a transformation that was already beginning under predecessor Brady Dougan. Revenues are down 35% from pre-crisis levels but are now shared evenly between asset/wealth management and the corporate and investment bank. Increasingly the focus is on having the CIB serve wealth clients. Investment banking and markets revenues have halved since 2006, down 19 percentage points as a share of the total, the fourth-biggest drop among the 12 banks. But the 52% of revenues coming from broader CIB puts it just above middle of the pack.
DEUTSCHE BANK Revenues down 18% New-look Deutsche Bank under chief executive Christian Sewing is harking back to well before 2006, with a focus on corporate banking and cutting back the trading that it boasted pre-crisis. The ditching of equities is only the latest driver of a 55% fall in investment banking and markets revenues, which now contribute less than a third of the total, about the same as retail banking. Total revenues are down 18%, with the investment bank’s contribution falling 25 percentage points, the biggest drop of our 12 banks. Transaction banking is much more Sewing’s cup of tea – only at HSBC does it contribute a bigger percentage of overall revenues.
GOLDMAN SACHS Revenues down 3% It is a measure of how dominated by its investment bank the pre-crisis Goldman Sachs was that it remains its top revenue contributor despite the biggest shift in revenue mix among all 12 banks. That shift still leaves the firm with a mix that looks like Morgan Stanley in 2006. Fixed income trading is now about half its pre-crisis size. The firm’s focus has been on broadening the scope of its wealth and asset management businesses, alongside early steps in corporate lending and consumer banking. But it is still an investment bank. Its CIB is the third biggest contributor of revenues of any category at our 12 banks, behind retail at BNP Paribas and asset/ wealth management at UBS.
HSBC Revenues down 15% HSBC’s corporate and investment bank has swapped places with its retail bank for dominance of the group’s revenues, accounting for 54% of the total. Retail revenues have nearly halved in absolute terms, while investment banking and markets has seen a 20% increase. But alongside Bank of America, the investment bank is still the smallest contributor to total revenues among the 12, at just 20%. What has ballooned is transaction banking, although not by as much as the numbers suggest, given that some of that business was previously reported within commercial banking. Nevertheless, at 24% of total revenues, it is now the most important transaction banking franchise for any of the 12.
JPMORGAN Revenues up 89% The undisputed winner of the crisis, JPMorgan is the biggest firm of the 12 and the one showing the biggest revenue increase – helped by a credit card business that has doubled in size. Most remarkably, considering the overall 89% increase in revenues, JPMorgan is also one of the least changed in its business mix. The share of revenues contributed by each category is within a few percentage points of what it was in 2006. Although its investment bank has increased revenues, it has shrunk slightly as a percentage of the total. There has been a greater focus on building the broader corporate offering: transaction services revenues are up 70%.
MORGAN STANLEY Revenues up 22% Chief executive James Gorman’s patient rebuilding of the firm after the crisis has seen it become, if not quite a wealth manager with an investment bank attached in the manner of UBS, then certainly a firm moving in that direction. Wealth and asset management now provide more than half the total revenues. The bank has seen the biggest diversification shift after Goldman Sachs, with the diff erence between the revenue share of its two biggest businesses falling 27 percentage points. Fixed income trading, where Gorman has slashed resources the most, is now half the size it once was, but, as he likes to note whenever possible, more profitable than before the resizing.
SOCIETE GENERALE Revenues up 12% Total revenues are up since before the crisis, although by much less than at rival BNP Paribas. But Societe Generale is even less changed in its revenue mix than its French peer over that period. As at BNPP, its biggest business remains retail. Its fixed income, currencies and commodities, and equities businesses are marginally smaller in absolute terms than they were in 2006, and asset and wealth management has also shrunk on an absolute basis and as a share of the total. The bank is one of five where the CIB has increased its importance to the group, but only by 2 percentage points.
UBS Revenues down 22% Throwing in the towel on capital-gobbling markets businesses earlier than most after the crisis has seen UBS put its eggs firmly in the wealth basket, with a reshaping even starker than Swiss peer Credit Suisse. In sheer percentage terms, its 62% share from asset and wealth management is beaten only by the 65% that BNP Paribas gets from retail. Overall revenues are down 22% in dollar terms. Its CIB vies with BNPP’s in terms of making the smallest share of group revenues. Investment banking and markets revenues have more than halved; their 20 point fall in share of the total is topped only by Goldman Sachs and Deutsche Bank.
Disclaimers and methodology As usual when comparing global banks, there are many challenges. Banks report their earnings in very different ways and have all changed their divisional structures since 2006. Revenues that once appeared in one division may now be reported elsewhere, often in several different businesses. As far as possible, we have looked at the business lines within each reporting division of a bank and allocated them to a broader category. These broad categories, as shown in the pie charts, are retail banking (blue), corporate and investment banking (yellow), and asset and wealth management (green). In every case throughout this analysis, ‘revenues’ refers to operating divisions only; ‘corporate centre’ or similar divisions are excluded. This means that our revenue change figures between 2006 and 2019 will not reconcile with banks’ reported group revenue figures. There are a few notable caveats: UBS does not separate personal from corporate banking in its Swiss Universal Bank; Barclays no longer breaks out any asset or wealth management revenues separately from its other divisions; Goldman Sachs used to report its principal investments within its investment bank but has now recategorized them as asset management; the French banks do not report investment banking revenues separately; securities services has been classified within investment banking and markets, but Deutsche Bank combines it with transaction banking; and where dollar conversions have been used for aggregate figures, the exchange rates taken are an average of the year-start and year-end rates for the year. |