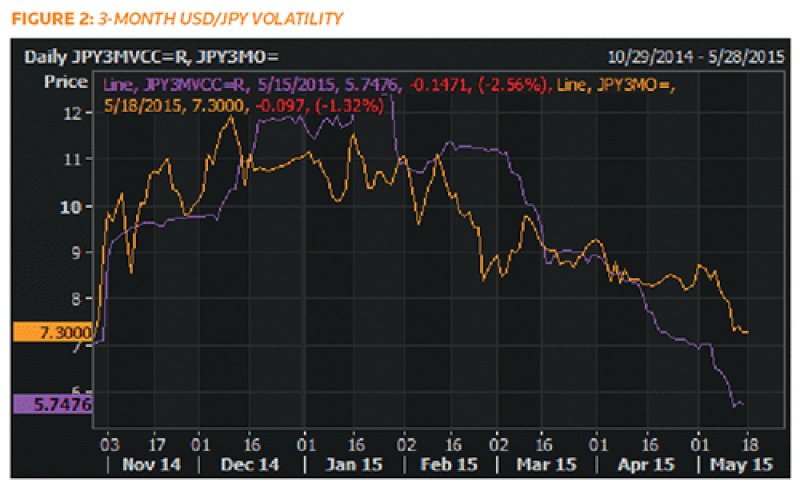
Exchange rate volatility has trended higher in 2015 as expectations of a Fed rate hike and the Greek debt situation have both evolved. Implied vols for most currencies are above 2014 closes; but the JPY is an exception as volatility has drifted lower. USD/JPY 3-month implied volatility is now at levels traded in the fourth quarter of last year. As shown in figure 2, the contra-trend down-drift of USD/JPY implied volatilities makes them the lowest for any G10 currency vs the USD.
The combination of JPY vols trading near the lows of the year (and well below other G10 vols) might make it appear to a corporate treasurer that JPY options are an attractive way to hedge exposure. But sometimes prices are low for a reason, and this seems to be the case for the JPY. The red bar in figure 1 below shows 3-month implied volatility relative to 3-month realized volatility.
While JPY implied volatility is low relative to other G10 volatilities, it is quite high relative to where volatility is realizing. The case for JPY implied volatility being expensive is perhaps even more evident in figure 2. While implied volatility is near the year lows, a wide gap has opened between implied and realized. This divergence suggests there is probably a bias for JPY implied volatility to sink still lower so options may not be good value after all.
So how then does a corporate treasurer, or any other FX market participant, evaluate vol value opportunities?

|
|
|
Scanning for volatility value
Thomson Reuters introduced the Currency Value Tracker into Eikon in April 2015 to allow users to quickly screen a variety of metrics to get a broader picture of dearness and cheapness. The tracker allows the user to build a custom array of volatility and carry oriented metrics and set tolerance filters to isolate market extremes. In the example in figure 3, the tracker is filtering implied volatility outright and relative to realized vol with blue and red indicating market extremes of lows and highs, respectively.
This framework makes it apparent that it is ambiguous whether JPY volatility is cheap relative to other currencies. NOK volatilities are in the opposite situation of being high outright but low relative to realized. EUR/GBP volatility stands out as being relatively low on both metrics, making it the best candidate for using options as a vehicle for hedging exposure.

|
Taking the ‘risk’ out of risk-reversals
Risk-reversals are another factor that users can filter in the Currency Value Tracker. This is particularly important for hedgers as it highlights situations when risk-reversals offer particularly skewed reward vs risk compared to using a forward. Since skew tends to widen as volatility moves higher, it is important to assess extremes relative to implied volatility as well as on an outright basis.
A scan of the table in figure 4 indicates that JPY volatilities are not strongly skewed outright or on a vol-adjusted basis. AUD skew is more extreme (bright blue) outright but only modestly extreme when adjusted for the level of implied volatility. EUR skew is also the most extreme (bright blue) outright and is also extreme adjusted for implied volatility, suggesting that users that need to hedge a short EUR/USD position (so the risk reversal would be short the more expensive put and long the relatively inexpensive call) should consider using risk reversals instead of forwards.

|
Scanning for value in carry
Hedgers also need to be able to make assessments of the cost of carry. In addition to reporting current outright annualized net carry, the tracker also allows the user to filter carry relative to realized and implied volatility. The Currency Value Tracker also includes ’static‘ carry, which is a ratio of the net carry return vs the cost of buying at-the-money forward vs at-the money-swap call spread. This ratio specifically shows the potential return of capturing carry via options. Static carry is somewhat useful for hedgers as it can
help identify currencies where low delta options are better value vs at-the-money options but it is particularly useful for investors looking for opportunities to earn carry. A high ratio indicates option volatility is underpriced relative to carry.
The tracker can produce the chart in figure 5 with outright net carry and vol-adjusted carry on the axes and the bubble size indicating static carry. Currencies in the upper right are relatively expensive to short while currencies in the lower left are expensive to be long. EUR/NZD particularly stands out as having the highest carry while also offering relatively high static carry.

|
Eikon users can access the Currency Value Tracker in the App library or by typing ‘FX Ranker’ in the navigation bar. For those wanting more information on this product, please send inquiries to fx.info@thomsonreuters.com.