By Kevin Rodgers
 |
|
|
| More data |

If you had fallen into a deep coma in 1999 and woken up in 2017 (a state of affairs that is not too hard to imagine, given the way brokers were back then), there would be a lot of things that would surprise you as you came to: the sight of Donald Trump in the White House; the frequent reference to something called Brexit; and the concept of selfies.
But one thing that would not give you a big shock is the Euromoney 2017 FX Survey. If you squinted at it, it would look a lot like the one from 18 years earlier.
For example, there is Citi in its accustomed place at number one. JPMorgan (back then, just Chase) has moved up a place and Deutsche has fallen three, having shed a mere 1.44% of share. Bank of America has entered the charts (from number six in 1999). In both surveys, three US banks are in the top five.
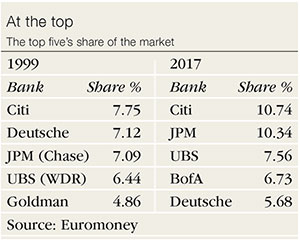 |
You might look at the market shares and notice that the top two banks seemed to have pulled ahead a little. You might also think that market concentration was increasing: the top five banks in 1999 had 33% of the market; in 2017, they have 41%. But overall, it all looks like there had been evolution, not revolution, during the 18 years.
Of course, you would be utterly wrong to think that the progress of the FX market during your coma had been a process of gradual change. One clue that something was now very different would be the proportion of FX that is traded electronically. That now stands at 64% of total flows. Electronic flows as a proportion of the total was not important enough to be measured in 1999; as recently as 2013, it was only 45%.
You might also scratch your head in puzzlement at the inclusion of a firm called XTX Markets. What on earth is XTX? But there it is at number four in the spot product charts with 6.41% share – bigger than established banks such as Deutsche and UBS. It is also number four in emerging currencies.
Then there is a client category called FX trading platforms that makes up 18% of all flows. This is dominated by XTX, though firms such as Citadel Securities, Jump and Tower also have a presence. You might wonder: ‘What is a trading platform?’
But by comparing the FX market now with its state at the birth of its modern day form in 1999, you would be missing a long period of time when things were radically different from both then and now.
You would be missing the long dominance of Deutsche Bank (my old employer), which in 2008 and 2009 captured over 20% of the market.
You would be missing a period where European banks looked like they had a stranglehold on FX. In 2009, only Citibank (clinging on at number five) kept the Stars and Stripes flying in the list of the top five biggest banks.
You would be missing the rise and subsequent fall of firms such as Barclays (number two in 2011; seventh now) and RBS (fourth in 2009; now 13th). And you would be missing the years where the top five banks captured 60% or more of the market – not 40%.
Technology
In my view, technology was the root cause of the changes from 1999 onwards and is, in part, the explanation for why we seem to have come full circle.
Let me explain.
FX is a market where scale matters. There is a natural advantage in having a big capital base and a big balance sheet. Although FX is not hugely balance-sheet intensive in itself, a large loan book can be leveraged into FX business.
Being unconstrained on balance sheet also helps in the FX forwards, options and swaps markets (fully 50% of all FX flow in the survey is swaps). Having FX as part of a large banking or investment banking business also creates opportunities for economies of scale and scope on IT development.
|
|
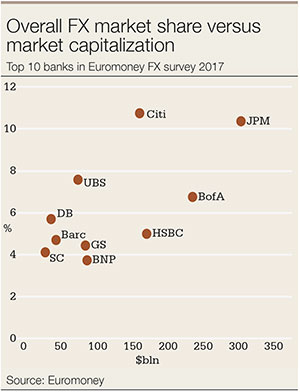
Indeed, if you plot market shares in 2017 against market capitalization, a clear trend emerges: overall, big banks capture bigger shares.
But wasn’t it always the case that size gave banks a competitive advantage? Why was the picture so different from 2002 onwards? And why did it eventually revert?
In short, because for years smaller banks – such as Deutsche, Barclays and UBS – used technological innovation to punch above their weight. With price-making and price-distribution systems (Autobahn or Barx, say), they were able to capture price sensitive market share from their bigger, usually US rivals. Customers’ fears during the 2007/08 crisis that US banks were more risky to deal with also helped the Europeans. A lot of business was diverted into their – nominally – safer hands.
But since then, the advantage has eroded.
US banks have fixed their perceived riskiness much faster than those in Europe. As a recent ‘Economist’ article put it: “All in all, European banks have fallen behind their US counterparts. In investment banking, where they compete head-to-head, the gap is worryingly wide.”
In part, this is because the US’s response to the crisis was much quicker and stronger, and because the US customer base recovered more quickly from the crisis. US banks have an arm-lock on this market: the top four banks in the Americas in this survey are from the US.
By contrast, in Europe, the problems (whether sluggish growth, sovereign indebtedness or weak banking balance sheets) have not yet gone away. It cannot have helped Deutsche’s FX team in this survey, for example, that the market seemed to be convinced that the bank was going to fail in September of last year.
The importance of scale and credit is underlined when you look at the results in some of the product categories. In spot and forwards, swaps and options, the US banks are dominant. Indeed, in options, the top three slots are all held by US banks, while Deutsche slips to number four from the number one position it has held since 2011 (when the category was first reported separately).
Deep pockets
Another reason that the systems advantages of the European banks have been eroded is that it has been possible for other banks to catch up technologically. Having deep pockets matters a great deal when competing in IT – another advantage of scale. Systems experts can be hired and technology can be replicated. Indeed, in some ways, being a late starter has helped. There are fewer legacy systems to keep running while you build the new. The success of entrants such as XTX is testament to this.
Another, more subtle, factor has been the shift in the weighting of various customer groups. In the last few years, the importance of customer segments such as real money and corporates has grown (from 31% of flow in 2013 to 40% now).
These segments are less amenable to purely technological solutions and are less subject to the winner-takes-all effect. Real money still relies on panels of banks to give business to. Corporates have more complex needs than mere price. Although there has been heavy spending on electronic solutions in these spaces there is no clear winner yet.
This is why the market share of the number-one provider to corporates and real money is about 10%, rather than the 15% or so for leveraged funds and platforms where price dominates. This partly explains the fact that market concentration has diminished, so that the top five banks now handle around 40%, not 60%, of all flows.
The decline of the importance of leveraged funds is also very noticeable. In 2011, their flows made up 22% of the total; in 2017, the proportion has halved to 11%. The shrinkage of the huge macro funds in the face of difficult-to-trade, flat and becalmed interest rate markets has been an important driver of this trend. For example, Brevan Howard’s assets under management have fallen from $41 billion in 2013 to around $17 billion now.
Overall, because of shifts in the product mix and a levelling of the technological playing field, the advantages of scale (balance sheet; access to funding for IT; large corporate customer base; etc.) are starting to prevail again after a decade or more of smaller rivals outperforming. As such, the period from 2001 to 2014 might be seen as a historical outlier in a decade or so.
What of the future? If I am correct in my assessment of what has been driving the markets, a couple of questions occur to me.
First, given its scale, could HSBC become the big European champion in the FX markets? The power of its corporate franchise is already evident in its number-two ranking in this sector.
Second, what will the market-making funds do? At the moment, they are competing vigorously in a niche (spot, especially through platforms) that suits their advantages. Will they expand their focus to short-dated forwards or even options and begin to upset the (newly) established order in FX markets just as the smaller European banks did from 2002 onwards?
All told though, barring another crisis or some new, imminent, disruptive technological revolution that I can’t foresee, my prediction would be that for the next few years the advantages of scale will continue to grind on remorselessly, even while new entrants nibble at the edges.
I’m not a great one for predictions but I suspect that if your coma had lasted from 1999 until 2018 and not 2017, the biggest change you would notice as you woke up would be that JPMorgan, with its immense scale and resources, had taken Citi’s crown as the number one FX bank.
After all, once again in the FX markets, size matters.
Kevin Rodgers is the former global head of foreign exchange at Deutsche Bank. His book: ‘Why aren’t they shouting? A banker’s tale of change, computers and perpetual crisis’ was published in 2016.