THE URGENT DRIVES out the important every time. The financial tidal waves emanating from $2 trillion of US sub-prime (and Alt-A) mortgages melting down has immediate effects on credit markets, stock markets, the economy and all asset prices. This drives concerns about climate change off the front page. Another factor pushing climate change policy action and economic/financial market consequences to the fringe is (paradoxically) soaring energy prices. Whatever action to combat climate change might eventually emerge, it is likely to involve a mix of carbon-emission taxes and quota trading that will achieve results by raising energy costs. As energy costs have been raised anyhow – to the distaste of ordinary people – by the combination of global boom, severe Chinese economic overheating, and speculation by investors pursuing the illusion of energy/commodity futures as an “asset class”, governments are hardly looking for ways of making themselves unpopular by taxing energy further.
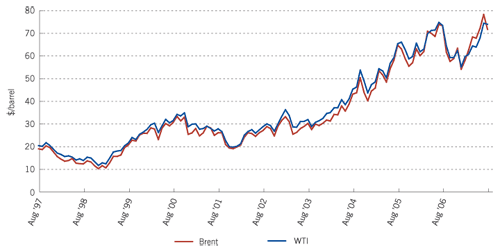
Perhaps recent energy cost increases have been enough anyhow for the time being. In a considered global programme of energy price escalation, it is unlikely that anybody a few years back would have proposed an immediate doubling of the chief market price for world energy: crude oil. Yet the crude price, after dipping briefly to $10 at end-1998 and early-1999 at the end of the Asian crisis (a bit more for West Texas Intermediate, WTI) reached a prevailing price level of $25 in the early years of this decade (see Chart 1). Now, a mere five (relatively non-inflationary) years later, oil users would be very happy if it transpires that the prevailing price level is as low as $50. In fact, it is probably $60, up some two and a half times. While coal and natural gas are up by less, this is quite a major incentive to lower energy use. And while prices may come down cyclically in the global slowdown we are entering the consensus is that the medium-term upward trend will resume – and it is hard to dispute this.
|
Chart 1: Crude oil prices |
|
Monthly average, except latest, $/barrel |
 |
|
Source: Lombard Street Research |
It is fortunate that the market is doing the “heavy lifting” on climate change action, because the forces of resistance are strong: multiple layers of opinion in the US; much of energy-guzzling Asia and the vanguard of the forces for change – the “greens” – have a fatal tendency toward frivolous irrelevancy. Most obviously, they: • concentrate their efforts on headline-grabbing gimmicks, rather than serious argument over the main issues;
• conflate their climate-change approach with other “green” issues by gross over-emphasis on transport, especially air travel;
• fatally weaken their case, and their entitlement to be taken seriously, by denial of the chief way forward in reducing carbon emissions from energy use: nuclear electricity.
The arguments for climate change action presented in the report commissioned for the UK government from Sir Nicholas Stern, published in 2006 are important because his logic has been severely attacked by many economists, and is in important respects fatally flawed. Yet his conclusion – that action to contain carbon emissions is vital – can be supported on much simpler grounds than the ones he advances. As we are here concerned with the economic and financial consequences of the issue, that conclusion is the key point: getting the argument in support of it is important, but the consequences start from the conclusion.
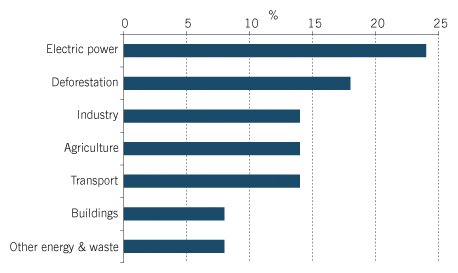
Chart 2 shows the error of undue focus on transport as a means of reducing greenhouse gas emissions. This is doubly true of air transport, which only accounts for three percentage points of the 14% transport quota shown in the chart. The top two sources of greenhouse gases are electricity usage and (surprisingly) deforestation, with industry, agriculture and transport equal third. Deforestation is a separate matter, being the only aspect of mitigating greenhouse gas emissions where either cutting energy demand or substituting carbon-light energy sources is not directly relevant. Indirectly it affects the energy issue, as cutting down of forest for alternative land use, generally agriculture, might be motivated by the desire to produce sugar-cane-based ethanol (as an “environment-friendly” fuel) in Brazil, for example. Even in the US, reforestation of formerly agricultural land is common and could be more so; the corn-based ethanol idea as a gasoline substitute might not save many carbon emissions, therefore, aside from its effect in driving up food prices.
| Chart 2: Sources of Global Greenhouse gas emissions |
| Percent |
 |
|
Source: Stern Report |
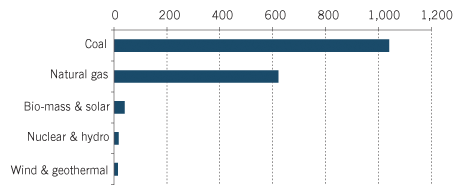
Transport (in total – not just much-abused air travel) makes a little over half of electricity’s contribution to greenhouse gas emissions and is already heavily taxed. Any form of even-handed treatment of various sources of greenhouse gases will be heavier in its effects on electricity, which throughout the world is for the most part lightly taxed, or not all – quite the contrary, it is often subsidized. Any approach that focuses on making transport more expensive, or controlling it by other means, is likely to be founded on populist evasion of this chief point. The Greens have correctly seen that carbon-light electricity production might cut the Gordian Knot, as far as electricity is concerned. But this does not justify focusing purely on transport, because they are further crippled by their resolute opposition to nuclear electricity generation, an inheritance from genuine problems in the past that have been heavily emphasized by environmentalists. Chart 3 illustrates the scale of gains to be made from avoiding carbon fuels in electricity generation. Natural gas causes emissions 10 times greater than biomass and solar, and 15 to 20 times greater than nuclear, wind power and geothermal. Coal is roughly twice as productive of greenhouse gases as natural gas, per KwH of electricity. The world average of emissions is some 500gm/KwH, and is almost certainly expanding as China’s huge electrification programme is largely coal-based.
|
Chart 3: CO2-equivalent emissions in electricity |
|
Generation by primary energy sources, gram/kilowatt-hour |
 |
|
Source: US Nuclear Energy Institute (German electricity production analysis) |
Nuclear power accounts for about 16% of world electricity output but is as high as 80% in France. We therefore come up against country statistics such as (for 2004) around 900gm of CO2 per kilowatt-hour generated in China and India, 575gm in the US, 450gm in the UK, Germany, and Italy, and under 90gm in France. You do not have to be a nuclear physicist to see where that directs climate change policy. Although solar and wind-based power are equally carbon-light, they vary enormously in both availability by region and, given changes in the weather, potential output per production unit over a given day (or week, or any other period). Reliable, low-carbon electric power will depend on a major expansion of nuclear power. What does that entail economically and financially, and what is the timing? Big changes of course in the world economy generally require a burst of investment – the more so in this case, as we are looking at heavy-duty infrastructure. But little of substance is likely to happen before the US 2008 elections, and even then a major nuclear programme will take years to build up. So the pressure comes in the next decade. Interestingly, that is the period when we at Lombard Street Research are expecting global inflationary pressures to mount. The two reasons for this are that the retirement of baby-boomers could lead to a substantial downward shift in saving rates in Japan and Europe, while the under-spending that is producing the current savings glut in developing Asia – especially China – should begin to give way to a more normal pattern: China’s national savings rate is currently an extraordinary 50% of GDP.
Of course, monetary policies might be adjusted to ensure that no sustained inflation occurs. But in that case the simultaneous fall in propensity to save and rise in the need for infrastructure investment implies higher real interest rates, and probably a swing toward surplus in government budgets. This is the reverse of the condition of the past five to 10 years, in which the Eurasian savings glut has not only permitted/required large government deficits, but also lower real interest rates to induce real estate and housing investment, and US household dis-saving.
In the period of baby-boomer retirement, inflationary pressures and high real interest rates could reverse the long cycle of declining interest rates we have seen since 1982. Long-cycle theorists often say that each interest rate cycle lasts for two stock market cycles. As the latter last about 30 years – peaks in 1879, 1909, 1929, 1965 and 1999 for four peak-to-peak cycles in 120 years – that makes the interest rates cycles very long indeed. Layering the current economic downswing onto this outlook, we can envisage real and nominal interest rates hitting a cyclical low around 2009. That would be more than 70 years after the low point of interest rates after the Depression. But real interest rates were negative for much of the 1970s, owing to high inflation, so long-cycle theory has some explaining to do. Whatever, the thought that real and nominal interest rates could reach a major low point in a couple of years, supported by multiple longer-range economic factors, could be an interesting strategic financial benchmark.
The uranium non-bubble
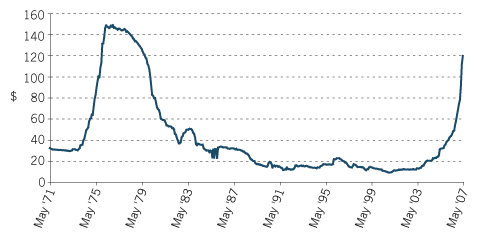
A possible area of immediate interest for speculative financial types could be uranium, the metal whose nuclear reaction creates the energy that is converted into electricity. The Asian savings glut has sustained the world economy against its inherently deflationary effects (its flip-side being under-spending) by means of a torrent of liquidity. This has spawned or exacerbated many bubbles, most spectacularly the end-1990s stock market bubble and more recent US and other housing bubbles, but also upshifts in the prices of oil, metals, etc. The case for the sustainability of the latter generally comes back to China: its exorbitant and presumed ever-soaring appetite for resources to drive its takeover of the world’s manufacturing. Chart 4 showing the progress of uranium prices puts it squarely in this group – as a leader, as most other price surges have been far less extravagant than this.
|
Chart 4: The uranium non-bubble |
|
Uranium spot prices, 1971-2007, constant 2007 $ |
 |
|
Source: Lombard Street Research |
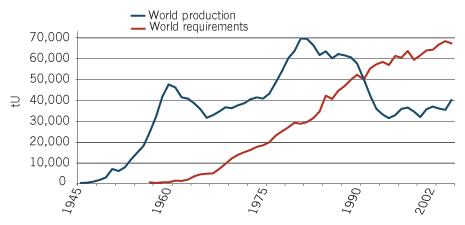
Whether or not Chinese demand will continue as assumed by the bulls, they also have to prove that supply cannot readily be expanded to accommodate such extra demand. This seems to be a problem for oil – implying its price gain of the past few years is mostly “for real” – but not for (for example) copper, whose production can, and is being, boosted sharply – implying it is a bubble. Uranium is quite different – for starters, nothing to do with China. More important, the gigantic imbalance between supply and demand is an accident that has been waiting to happen for more than a decade. Civilian use rose from virtually nil in 1960 to 50,000 tons in 1990, with production in those 30 years and earlier much higher: the Cold War nuclear “balance of terror”, or “mutually assured destruction (MAD)” proceeded apace. Since 1990, output has slumped below 40,000 tons, while demand has moved up to 70,000 tons (see Chart 5).
|
Chart 5: Annual uranium production and needs |
|
(1945-2004) |
 |
|
Source: Lombard Street Research |
Rising prices in a market where supply is only 60% of demand cannot lightly be called a bubble. For uranium this is exacerbated by demand for the metal being almost totally inelastic with respect to higher prices. The vast bulk of the lifetime cost of nuclear electricity lies in the hugely expensive capital facilities involved – given acute public concerns about safety. These are virtually all sunk costs, once production has started. Typically, the cost of the uranium “fuel” has been 5% of the total cost of the electricity produced, and even at recent over-$100/lb prices it is 20% or less. No reactor is going to shut down because of the huge increase in prices, for technical reasons as well as the profit between marginal revenues and marginal costs. Of course, there are mitigating factors. There would have to be. Release from military stockpiles, mostly Russian ones, has made up a great deal of the difference between demand and supply. But that is due to end contractually by 2013, by when production growth, though projected to be rapid, is highly unlikely to have eliminated the supply gap, given huge lead times and technical obstacles. And Russia is not the number one nomination for ideal energy supply partner, nice though “megatons for megawatts” looks on paper. It has already announced cessation of uranium exports from 2008, and throwing its weight about in global energy politics is the chosen route for president Vladimir Putin’s efforts to revive Russia’s great power status.
Climate change policies do not bear on this directly. No country will have decided to ramp up its nuclear electricity programme and build a reactor to be on stream by 2013. But many might have made the decisions in principle well before that date. And such countries might look at the imbalance of supply and demand for uranium and decide that a little precautionary inventory building is in order. So the release of inventory from official stockpiles upon which the world depends could be a waning factor well before output has risen close to demand. Given the price elasticity of the latter, the recent exit by speculators from uranium, taking the price back below $100, could be a case of reculer pour mieux sauter.
The un-Stern case for climate change action
Many economists have challenged the analysis of the Stern report – perhaps most of those that have looked at the subject with care. But the Stern report contained a very useful analysis of the economic consequences of climate change – global warming – that is a vital tool in developing policy. The weakness of Stern is the way he moved from useful numbers to controversial conclusions by means of discounted cashflow analysis, in pursuit of a cost/benefit approach to the merits of action to mitigate climate change. The questionable assumptions he made about discount rates and “intergenerational welfare transfers” have been the focus of strong – and in my view well-justified criticism. But this has distracted attention from the correct approach to climate change policy. So the chief value of Stern’s report lies not in cashflow analysis of its median-case outcomes under global warming. Worse, recommendations based on such analysis are liable to be argued over at length and inconclusively, so that political action will be weaker and later.
An illusion of weakness in the scientific consensus and Stern’s analysis arises from the huge uncertainty in estimates both of likely actual climate change itself, and of its economic impact. But paradoxically, this uncertainty is in fact the strongest argument for action to mitigate global warming. Why? Because even the worst-case outcome in Stern’s analysis is simply the lower boundary of a 90% probability band. Above that 90% band, of course, lies a benign set of possible outcomes that have 5% probability. But below it lies another, utterly disastrous set of outcomes that also have 5% probability. The argument for mitigation of global warming (Stern’s conclusion) is not some dubious cost/benefit calculation, but the simple and obvious truth that no group of political leaders confronted with a 5% chance of virtually destroying the human race will refuse reasonable costs to avoid it. This is no investment decision – not even some form of insurance policy – it is simply a necessary expense, part of the cost of living, like military defence or domestic law and order.
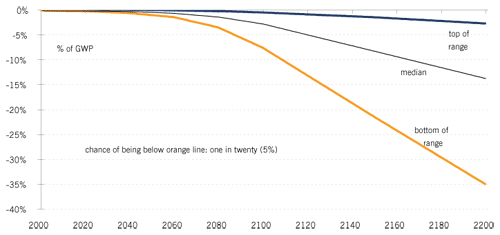
The median economic impact of global warming on gross world product (GWP) remains below Stern’s assessment of the cost of adequate mitigation (1% of GWP) for 80 years until 2096, on his numbers (see Chart 6). On a cost-benefit basis, very few people alive today would be net gainers even at the end of their life from mitigation, and nobody would gain over the whole body of their lifetime. The negative effects of climate change are projected to accelerate in the 22nd century and reach 10% in 2168, about 160 years hence. So that’s the basic penalty as assessed by Stern’s median projection. But real GWP per head is growing at a baseline rate of 1.5% or so (assuming present excellent growth in Asia cools off) and that compounds to an income level 10 times higher by 2068. A 10% global warming penalty would cut that to 10 times. So the entirety of the current population would be sacrificing itself to ensure that our grandchildren’s grandchildren are 11 times better off than us, rather than 10 times.
|
Chart 6: climate change impact |
|
90% confidence range |
 |
|
Source: Stern Report |
Given the uncertainties involved, the Stern cost-benefit analysis is a ludicrous stretch. He gets a positive result by assuming a discount rate for these future generations’ welfare of close to zero – even though such a distinction between environment-friendly “investment” to mitigate global warming and all other capital projects – for which the cost of capital is market rates – is flimsy and unsustainable. In fact, the internal rate of return (IRR) in the Stern median mitigation projections is 4.25%, well below what normal economics would suggest as necessary for projected returns of such uncertainty. The attempt to use a near-zero “intergenerational rate of discount” amounts to what Jeremy Bentham might have called “bawling on paper”. What is so frustrating about Stern’s use of these arguments is that it plays into the hands of people in wilful denial about climate change dangers. (We all know from financial markets, recently and in the 1999-2000 stock market bubble, how prone to wilful denial remarkably intelligent people can be. Brains are used for clever intellectual cover-up, rather than to elucidate the truth). Uncertainty vis-à-vis the climate change downside suggests significant risks of catastrophe. These cannot be ignored.
The chart shows the 90% confidence range of possible penalties from global warming. The estimates shown for the downside case – with a one-in-20 chance that the outcome will be worse – involve costs of 25%, 30% and 35% of GWP. Such outcomes would be inherently out of control, since the stress to which the world’s weather patterns would have been subjected would be outside the range of reasonable prediction. Self evidently, if there is a 5% chance of results being significantly worse than this downside curve then in the ordinary course of events governments would be spurred into action – much as they might be, for example, if a large asteroid was on a possible collision course with earth, but were in some way divertible at great expense.
It is tempting to treat this as meaning insurance rather than investment is the chief economic argument for mitigation. But presenting it as insurance understates the case. If my house burns down and I collect on the insurance, I can then buy another – or rebuild my house. No such recovery of value will be possible if climate change spirals into the downside case and leads to catastrophe for humanity. In this sense the downside case – a 5%, one in 20, chance of disaster – means mitigating global warming should simply be regarded as part of the cost of living. Governments spend money on military defence because it is regarded as a necessary preventive, protective measure. Likewise, law and order – the police and the law. Neither are (or can be) presented as an “investment”. Education may be regarded and referred to as an investment, but it is financed as a necessary current expense, and rightly so.
Mankind may be global guardian of the “planet” and some regard that as sufficient cause for action. But hard-headed politico-economic thought – or even simply Darwinian concern for our own species, without starting to bring in the interests of our “dumb friends” – is enough to make the case.